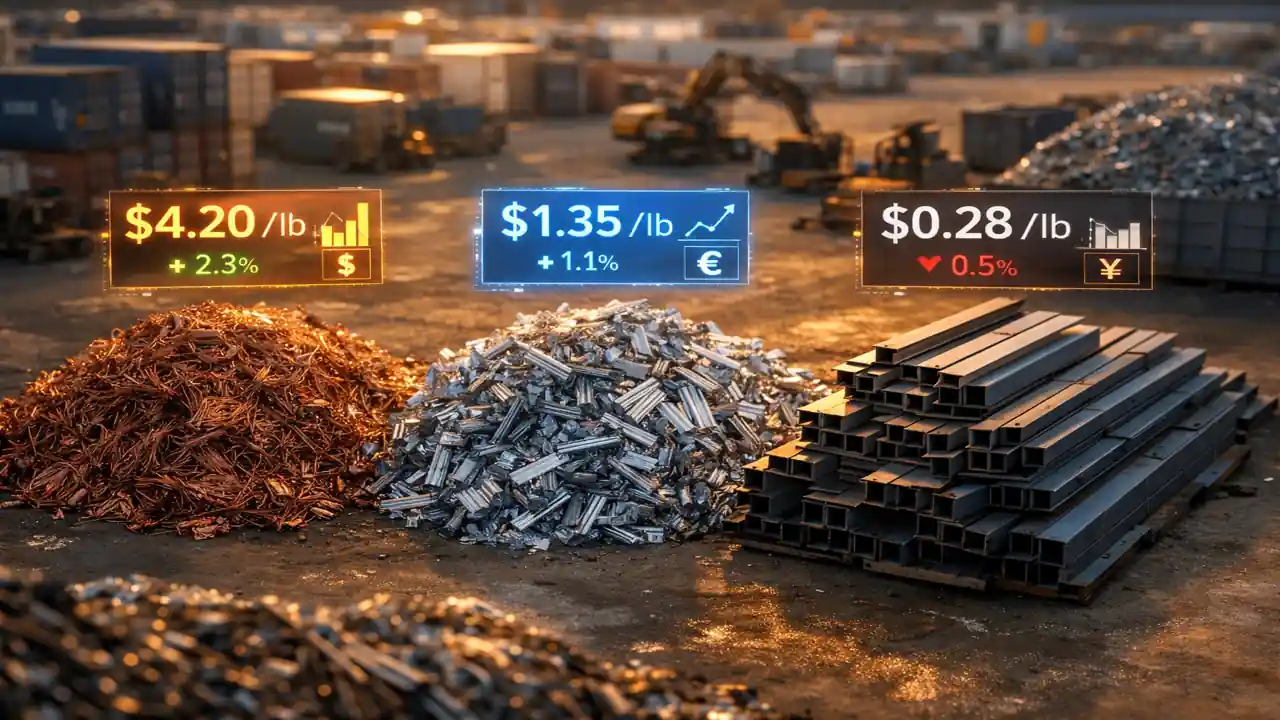

The global scrap metal industry as of April 5, 2026, is operating within a paradigm defined by extreme price volatility, localized digital transparency, and a fundamental restructuring of supply chains due to active conflict and protectionist trade policies. The landscape is bifurcated between a non-ferrous sector reaching historic highs led by copper’s ascent past the $6.00 per pound threshold and a ferrous sector struggling with a bearish tilt as industrial demand in China decelerates and global freight costs escalate.1 This report provides an exhaustive examination of these dynamics, centering on the digital evolution of the Australian market through platforms like scrap.trade and onlinescrapyard.com.au, the policy-driven volatility in North America, the energy-constrained environment of Europe, and the surging infrastructure demand in South Asia.
The Australian Digital Scrap Ecosystem: Transparency and Real-Time Valuation
The Australian scrap metal market has undergone a significant digital transformation by the second quarter of 2026. The emergence of platforms such as scrap.trade and onlinescrapyard.com.au has introduced a level of transparency previously unavailable to smaller yard operators and individual sellers.3 These platforms function as real-time intelligence hubs, providing not just price sheets but advanced trading tools, supply-demand analytics, and market forecasting.3
Digital Market Mechanisms on scrap.trade
The platform scrap.trade has established itself as a primary benchmark for non-ferrous pricing in Australia. By April 3, 2026, the platform’s pricing calculator integrated London Metal Exchange (LME) spot trends with domestic logistics factors to provide granular pricing for specific grades of copper, aluminum, brass, and lead.3 A critical observation in the current market is the significant premium placed on high-purity materials. Bare Bright copper, which consists of uncoated, unalloyed wire of at least 1.6mm thickness, represents the pinnacle of the copper scrap hierarchy.3
The following table details the real-time pricing for non-ferrous metals in the Australian market as of April 3, 2026, reflecting the high resolution of digital data available to modern traders.
| Material Grade | Specification | Price (A$ / kg) |
| Copper – Bare Bright | Uncoated wire ≥ 1.6mm | 14.48 |
| #1 Copper | Clean pipe, clippings, bus bars | 13.60 |
| Copper Pipes & Tubes | Clean plumbing-grade material | 13.30 |
| #2 Copper | Mixed grades, slightly oxidized/painted | 12.12 |
| Copper Fittings / Bends | Elbows, tees, valves (may contain solder) | 11.53 |
| Insulated Copper Wire (ICW) | Copper wire with plastic/rubber insulation | 7.094 |
| Yellow Brass | 65-70% Copper content | 9.164 |
| Red Brass / Gun Metal | High-copper (85%+) content | 10.64 |
| Mixed / Dirty Brass | Contaminated or unsorted | 8.129 |
| Lead Sheet / Pipe | Clean roof flashing, sheet, and pipe | 2.882 |
| Lead Wheel Weights | Mixed metal (approx. 85% Lead) | 2.143 |
| Zinc Die-Cast | Door hardware, carburetors, toys | 3.325 |
| Tin Scrap | Clean tin or high-tin alloys | 32.52 |
The pricing logic on scrap.trade indicates that “dirty” or “mixed” grades suffer a valuation discount of approximately 10% to 15% compared to their clean counterparts, illustrating the market’s emphasis on processing efficiency and the avoidance of cross-contamination.3
Marketplace Dynamics of onlinescrapyard.com.au
Complementing the real-time pricing of scrap.trade, onlinescrapyard.com.au operates as a decentralized marketplace where transparency is achieved through competitive bidding and open listings.4 The platform utilizes categories such as Steel, Copper, Aluminium, Plastic, and E-waste, allowing for diverse industrial waste streams to find liquidity.4 One of the most significant insights from the April 2026 data is the shift toward “expected price” listings, where sellers define their floor price or mark listings as “open for offers”.4 This mechanism is particularly effective during periods of high volatility, as it allows market participants to discover the optimal clearing price without being tethered to a static price sheet that may be rendered obsolete by intraday LME shifts.
The platform’s support for multiple units of measurement—Kilograms (KG), Tons, and Pieces—further caters to the varying scales of the industry, from local contractors selling copper offcuts to demolition firms liquidating tons of structural steel.4
Aluminum Grading and Secondary Market Strength
The Australian aluminum market demonstrates resilience, particularly in the extrusion and automotive segments. The spread between clean and painted extrusions is approximately A$0.37 per kilogram, reflecting the additional energy and chemical costs required for de-coating processes.3 Used Beverage Cans (UBCs) also command a strong price, often exceeding cast aluminum, due to their ease of processing back into high-value sheet stock.3
| Aluminum Grade | Price (A$ / kg) | Industrial Application |
| Aluminum Extrusions – Clean | 3.325 | Window/Door frames, channels |
| Aluminum Extrusions – Painted | 2.956 | Powder-coated structural items |
| Aluminum Cans (UBC) | 3.133 | Beverage container recycling |
| Cast Aluminum | 2.808 | Engine blocks, gearboxes |
| Aluminum Sheet / Plate | 3.178 | Cladding and roofing material |
| Alloy Wheels (Aluminum) | 2.660 | Cast automotive wheels |
| Aluminum Radiators | 2.513 | Al/Cu mixed heat exchangers |
| Aluminum Foil | 1.847 | Kitchen or packaging foil |
Beyond common metals, the digital platforms are seeing increased activity in high-performance nickel superalloys like Inconel (A10.05/kg), which are critical for the aerospace and marine industries.3 The presence of these materials in the Australian scrap stream indicates a maturing industrial recycling base that is capable of identifying and segregating complex metallurgical grades.
North American Market Volatility: Policy Impacts and Supply Chain Friction
The North American scrap market in April 2026 is defined by a “blazing start” for non-ferrous metals and a more tepid, uncertain environment for ferrous scrap.2 The primary driver of this divergence is a combination of historic copper demand and the reintroduction of significant trade protectionism under the U.S. administration.
The Historic Copper Break and Tariff Pressures
By early 2026, copper traded above $6.00 per pound both domestically and internationally for the first time in history.2 This milestone was driven by surging demand from the manufacturing and infrastructure sectors, coupled with supply tightness as imports slowed.2 However, this rally faced a “tariff-fueled plunge” in early April, as prices dipped to $4.10 per pound before rebounding to $4.90 within a 30-day swing.5 This volatility was exacerbated by China’s retaliatory 125% tariff on U.S. copper scrap, which effectively closed one of the largest export avenues for American recyclers.5
The impact on local yards, such as Arrow Scrap in New York, is immediate. On April 4, 2026, their updated price sheet reflected a cautious but still historically elevated position.6
| Grade | Arrow Scrap (April 4, 2026) | Metaloop Index (Dec 2025) |
| Bare Bright Copper | $4.00 / lb | $9,733.00 / t |
| #1 Copper Clean | $3.75 / lb | $9,733.00 / t |
| #2 Copper Dirty | $3.50 / lb | $9,228.42 / t |
| THHN Wire | $2.50 / lb | N/A |
| Romex Wire | $2.00 / lb | N/A |
| Insulated Wire (35-45%) | $0.75 / lb | N/A |
The data shows that while spot prices remain high, the “dirty” grades are seeing higher spreads, suggesting that processing facilities are pricing in the increased costs of labor and environmental compliance.
US Ferrous Scrap Trends: A Subdued Outlook
In contrast to the dynamic non-ferrous market, the U.S. ferrous scrap market enters April 2026 with a “mild downside bias”.1 The Fastmarkets Trend Indicator posted a reading of 46.9, which is below the neutral 50 threshold, indicating a softening of the trade.1 This bearishness is primarily driven by the buy-side, where consumers (mills) are cautious about near-term pricing, posting a sentiment reading of 40.7.1
Inventory levels, assessed at 49.0, suggest that stocks are close to normal, indicating that the downward pressure on prices is a result of softened demand rather than a supply glut.1
| Month (2026) | Steel ($/Ton) | Alloy ($/C.W.T.) | CRU Index ($/Ton) |
| April | 450.00 | 8.35 | 1,007.00 |
| March | 450.00 | 5.80 | 978.00 |
| February | 420.00 | 5.55 | 936.00 |
| January | 400.00 | 5.88 | 899.00 |
The AMM #1 Scrap index has held at $450 per ton since March, but the underlying alloy costs have risen significantly, jumping from $5.80 to $8.35 per hundredweight.7 This suggests that while base steel scrap is stable, the value of the metallic additives and specialized scrap grades is increasing, likely due to the ongoing shift toward higher-grade specialty steel production.
Operational Inflation and “Cost Pass-Through” Mechanisms
Inflation is fundamentally reshaping the U.S. scrap supply chain in 2026. Higher fuel, electricity, and labor costs are squeezing margins for yard operators.8 These operational expenses are increasingly “passed through” the supply chain. When upstream costs—such as steel fabrication—rise due to inflation, the secondary scrap market feels the effect.8 Furthermore, logistical bottlenecks and freight inflation, exacerbated by changing trade patterns and geopolitical tensions, have increased the landed cost of scrap metal.8
Even weather events have become a pricing variable. Winter storms and heavy rainfall in early 2026 prevented collection trucks from operating in some regions, temporarily tightening supply and pushing prices higher in localized pockets.8
European and Mediterranean Markets: The Geopolitical Premium
The European scrap market is uniquely exposed to the dual pressures of regional conflict and the European Union’s aggressive decarbonization policies. As of April 2026, prices in Europe show significant regional variation, influenced by the “Iran war” and the resulting spikes in energy and logistics costs.9
The Turkish Market and Mediterranean Shipping
Turkey remains the pivotal player in the Mediterranean scrap trade, often setting the price floor for European exports. In March 2026, Turkish scrap prices hit 20-month highs due to limited supply and higher freight rates.9 However, by early April, the Turkish market was described as “muted” as steel sales stalled.11
A significant development is the price of shipbreaking scrap, which was reported at 378.00 USD in Turkey as of April 5, 2026.12 This segment of the market is gaining importance as a source of heavy melting scrap (HMS) in an environment where traditional collection streams are hampered by logistics.
| European Grade | Index Date (2026) | Price (USD/Tonne) | Trend |
| Copper Dry Bright | Jan 2 | 6,000.00 | Strong |
| Copper Tube | Jan 2 | 5,200.00 | Strong |
| Aluminum Cuttings | Jan 2 | 1,350.00 | Upward |
| UBC | Jan 2 | 1,250.00 | Upward |
| Lead Scrap | Jan 2 | 1,800.00 | Stable |
| Grade OA Structural | Jan 2 | 180.00 | Stable |
While these figures from early 2026 provide a baseline, reports from March 31 indicate that Italian scrap prices have flattened in the first contracts of April, after expectations of an increase.11 In Germany, scrap prices fell by 1.3% in March and have largely held steady since, as adequate supply balanced against mill resistance to price hikes.9
The Impact of Carbon Border Adjustment (CBAM)
A critical factor for the European market is the Carbon Border Adjustment Mechanism (CBAM), which is now entering a more rigorous implementation phase.13 Traders must now account for the embedded carbon emissions of their imported products. The CBAM calculator for unwrought aluminum (HS7601) utilizes variables such as the EU Carbon Price (€/tCO2e) and ETS Benchmark Factors to determine the total cost of imports.13 This policy is creating a “green premium” for scrap produced within the EU or in regions with low carbon intensity, further fragmenting the global scrap price index.
Asian Markets: China’s Deceleration and India’s Expansion
The Asian scrap market is currently the site of a profound structural shift. China, historically the world’s largest scrap consumer, is seeing its market contract due to a maturing economy and industrial overcapacity, while India is emerging as a high-growth destination for both domestic and imported scrap.10
China’s Ferrous and Non-Ferrous Correction
The Chinese scrap market saw a broad price drop on the index on March 31, 2026.15 Copper scrap recorded the sharpest fall, with key grades dropping by up to CNY 400 per metric ton.15 This correction is tied to a 3.6% decline in Chinese steel production in February and a general reaffirmation by Beijing to reduce overcapacity in the sector.10
| Chinese Grade | Price (CNY / MT) | Date (2026) | Daily Change |
| #1 Copper Bare Bright | 97,800.00 | March 31 | -400 |
| #1 Copper Wire/Tube | 96,250.00 | March 31 | -400 |
| 6063 Al Extrusions | 20,850.00 | March 31 | +150 |
| Aluminum Ingot | 19,850.00 | March 31 | +150 |
| 310 Stainless Steel | N/A | March 31 | -100 |
| #1 HMS | Stable | March 31 | 0 |
Despite the drop in copper, aluminum scrap and ingots in China posted gains of up to CNY 150 per metric ton, reflecting positive momentum as April marks the traditional peak consumption season.13 However, the long-term outlook remains cautious as construction activity—the primary driver of scrap demand—recovers slowly due to the prolonged property downturn in China.9
India: The New Hub of Scrap Demand
India’s scrap market is exhibiting strong bullish behavior. BigMint’s ferrous scrap index jumped INR 1,000 per ton in a single day (April 1, 2026) due to tight supply and improved steel demand.14 The country is increasingly reliant on imported scrap to feed its growing fleet of Electric Arc Furnaces (EAF). For example, Tata Steel recently commissioned a new scrap-based EAF plant in Punjab, underscoring the shift toward secondary steelmaking.12
| Indian Market | Delivery / Origin | Grade | Price / Trend (April 2026) |
| Melting Scrap | DAP Chennai | HMS 80:20 | Rising (INR +900 d-o-d) |
| Shredded Scrap | CFR Nhava Sheva | US Origin | Firm Trends |
| Shredded Scrap | CFR Nhava Sheva | Europe Origin | Firm Trends |
| Copper Motor Scrap | CFR Mundra | US Import | Weekly Quotes |
| Brass Honey Scrap | Exw Jamnagar | 60-65% Cu | Daily Updates |
The Indian market is also heavily influenced by imported containerized scrap from Australia and Europe. Prices for shredded scrap from Australian origins (CFR Chennai) are tracked on a biweekly basis, showing the deep logistical ties between the two regions.16
Commodity Focus: Copper’s Strategic Scarcity
The performance of copper in early 2026 is indicative of its status as a strategic mineral for the global energy transition. The London Metal Exchange (LME) spot price for Grade A copper reached $12,967.1 per metric ton in February 2026, a massive increase from the $8,000-$9,000 levels seen in 2023.18
The LME Copper Price Evolution (2020-2026)
| Year | Month | LME Spot Price (USD / MT) |
| 2026 | February | 12,967.1 |
| 2026 | January | 13,088.1 |
| 2025 | December | 11,802.8 |
| 2024 | December | 8,912.6 |
| 2023 | December | 8,393.6 |
| 2022 | December | 8,366.8 |
| 2021 | December | 9,549.1 |
| 2020 | December | 7,755.2 |
The data illustrates that copper has entered a new price regime, with the $12,000-$13,000 range becoming the new baseline.18 This surge has directly influenced the global scrap industry by making recycled copper (scrap) an essential rather than a supplemental feed for primary smelters. In Asia, aluminum premiums have also reached 11-year highs, indicating that the scarcity is not limited to copper but is a broader non-ferrous phenomenon.19
Supply Shocks in the Aluminum Sector
The aluminum market in April 2026 is reeling from supply shocks in the Middle East. Geopolitical risks have become the “core variable” dominating market sentiment.13 Missile attacks on production facilities in the UAE (EGA) and Bahrain (Alba) have damaged infrastructure and prompted expectations of large-scale production cuts.13 This has widened the global aluminum supply gap and intensified concerns about supply outside of China.13
LME Aluminum Cash-Settlement prices reflect this volatility:
| Date | Price (USD / Tonne) | Stock (LME) |
| April 2, 2026 | 3,505.00 | 411,950 |
| April 1, 2026 | 3,583.50 | 414,175 |
| March 31, 2026 | 3,585.00 | 416,775 |
| March 30, 2026 | 3,482.00 | 418,675 |
| March 27, 2026 | 3,292.00 | 420,875 |
As prices spiked toward $3,500, LME stocks continued to decline, dropping from over 500,000 tonnes in early January to approximately 411,000 tonnes by April 2.21 This drawdown in inventory, combined with the “Middle Eastern panic,” suggests that aluminum prices will remain in a high-level consolidation pattern for the foreseeable future.20
The Rare Earth and Strategic Metal Conflict
Beyond common base metals, the scrap market in 2026 is increasingly sensitive to the trade in rare earth elements and strategic metals. China has restricted the export of seven key rare earth elements, including dysprosium and terbium, which are essential for high-performance magnets and electronics.5 This move has forced U.S. and European companies to ramp up domestic processing efforts and seek secondary sources from recycled magnets and motors.5
At the same time, the U.S. has fast-tracked permits for 10 mining projects, including copper, to reduce its dependence on volatile international supply chains.5 The nickel market is also in a state of flux, with prices surging 10% in a single day in early 2026 on short supply news, while the longer-term outlook remains cautious as the industry shifts from product competition to supply chain competition.2
E-Waste and Automotive Recycling: The High-Value Frontier
The recycling of high-complexity items like e-waste and automotive components has become a major profit center in 2026. The pricing for these items is no longer just about the bulk weight but about the recoverable value of the PGMs (Platinum Group Metals) and high-grade copper.
E-Waste Pricing in the USA
Data from April 4, 2026, shows that e-waste components are commanding premium prices.6
| E-Waste Grade | Price ($ / lb) |
| Laptops | 0.80 |
| Cell Phones | 2.25 |
| Servers (Complete) | 0.45 |
| Hard Drives with Board | 0.50 |
| Computers (Complete) | 0.40 |
| Circuit Boards | Varied (High) |
The Catalytic Converter Boom
Catalytic converter prices have hit three-year highs as PGM markets heat up.2 Rhodium is nearing $10,000 per ounce, while platinum and palladium have staged significant rallies.2 This has made automotive scrap an essential target for recyclers, with some specialized yards offering 6-day quoting and 10-day price locks for converters.5
Furthermore, the European Union’s EV policy changes are paradoxically driving demand for gas and diesel vehicles in the short term, which is keeping the demand for catalytic converters and their constituent PGMs robust.2
Macroeconomic Implications and Global Financial Sentiment
The scrap metal market is often a leading indicator for global economic health. In early 2026, the market reflects “huge uncertainty” and a breakdown of traditional asset relationships.1
The Disruption of Safe-Haven Correlations
Historically, geopolitical stress in the Middle East would drive safe-haven flows into gold and other precious metals. However, in March 2026, gold experienced its worst monthly performance since 2008, declining by 12%.23 This suggests that investors are currently more focused on liquidity and the immediate impacts of currency dynamics and tariff-driven volatility than on traditional safe-haven models.23
The Federal Reserve and Interest Rate Expectations
The CME FedWatch indicator as of April 2026 suggests a 93.5% probability that the U.S. Federal Reserve will keep interest rates unchanged through June 2026.13 This stability in rates provides some support for industrial investment, but the “inflation hedge” performance of metals has become increasingly complex as multiple systemic risks—including war and trade friction—emerge simultaneously.23
Technical Grading and Sorting Standards in 2026
The maturity of the 2026 scrap market is visible in the rigorous grading standards applied across all regions. The distinction between “prepared” and “unprepared” steel, for instance, is critical for pricing.
Ferrous Grading: #1 Prepared vs. Unprepared
Prepared scrap steel, often called #1 Heavy Melting Steel (HMS), must be smaller than 5 ft by 2 ft and possess a heavy gauge of 1/4 inch or more.24 Anything larger is classified as unprepared, which requires additional processing time and energy at the yard, leading to a lower payout for the seller.24
| Grade | Price Indicator (2026) | Specification |
| #1 Prepared | $230.00 / ton | < 5ft x 2ft, 1/4″ gauge |
| #1 Unprepared | $195.00 / ton | > 5ft x 2ft |
| Shredded Auto | $385.00 / MT | Processed automotive steel |
| #1 Busheling | $395.00 / MT | Clean, new factory scrap |
In India, the HMS 80:20 grade remains the standard for both domestic and imported trade. This grade signifies a mix where 80% is heavy melting steel and 20% is lighter material, a ratio that is preferred by Indian induction furnace operators.16
The Evolving Role of Sustainability and the Circular Economy
Metals recycling has evolved from a waste-management function into a technology-driven industry critical to the circular economy.25 The energy-saving potential of recycling is the primary driver: recycling aluminum uses approximately 95% less energy than mining and smelting virgin ore.25 This environmental benefit is increasingly being monetized through carbon credits and “green metal” premiums.
Major industry players are rebranding their “scrap” divisions as “metals recycling” to better reflect this dynamic, technology-driven sector.25 This shift is not merely cosmetic; it involves significant investment in advanced sorting technologies—such as X-ray fluorescence (XRF) and laser-induced breakdown spectroscopy (LIBS)—which allow for the high-speed segregation of complex alloys that were previously too labor-intensive to sort.
Conclusion: Synthesized Market Outlook for Q2 2026
The global scrap metal market on April 5, 2026, is a study in geographic and metallurgical divergence. In Australia, the digital integration of trading through platforms like scrap.trade has empowered sellers with real-time intelligence, creating a highly efficient domestic market for non-ferrous metals.3 In North America, the market is characterized by extreme non-ferrous peaks and ferrous stagnation, as policy makers and industrial consumers navigate a “tariff-fueled” reality.1
Europe remains the most volatile region, where energy costs and the “Iran war” have introduced a geopolitical premium into every tonne of scrap.9 Meanwhile, the shift of the “demand center” toward India and Southeast Asia is accelerating, as these regions build out new, scrap-intensive steelmaking capacity.12
For market participants, the key to success in the remainder of 2026 lies in managing logistical risks and understanding the “policy-driven” nature of current price discovery. Whether it is China’s “reverse invoicing” policy 13 or the U.S. Section 232 tariffs 5, the “invisible hand” of the market has been joined by the “visible hand” of geopolitics. As copper continues its strategic ascent and the ferrous market finds its new floor, the scrap industry remains the essential, beating heart of the global industrial machine.
Works cited
- US scrap trends outlook: April 2026 – Fastmarkets, accessed on April 6, 2026, https://www.fastmarkets.com/insights/us-scrap-trends-outlook-april-2026/
- Copper Hits $6/LB! Scrap Prices Soar Across the Board to Start 2026 – YouTube, accessed on April 6, 2026, https://www.youtube.com/watch?v=kPyDnkKn-BU
- Scrap Trade: Buy and Sell Scrap Metal Online, accessed on April 6, 2026, https://scrap.trade
- Sell Your Scrap Online with Clicks, accessed on April 6, 2026, https://onlinescrapyard.com.au
- Copper Prices Go Wild: Tariffs, Trade Wars & Rare Earth Shocks | Scrap Market Report, accessed on April 6, 2026, https://www.youtube.com/watch?v=v3dltSjOWHU
- Current Scrap Metal Prices, accessed on April 6, 2026, https://www.arrowscrap.com/prices
- Steel Scrap Index, accessed on April 6, 2026, https://www.mnp.com/steelindex.php
- How Supply Chain Issues Are Changing Scrap Metal Prices 2026 – Blackrock Recycling, accessed on April 6, 2026, https://blackrock-recycling.com/supply-chain-inflation-changing-scrap-metal-prices-us-2026/
- Global Scrap Metal Market Trends in March 2026: Rising Prices Amid Regional Variations, accessed on April 6, 2026, https://www.indexbox.io/blog/global-scrap-metal-market-trends-in-march-2026-rising-prices-amid-regional-variations/
- Steel – Price – Chart – Historical Data – News – Trading Economics, accessed on April 6, 2026, https://tradingeconomics.com/commodity/steel
- Western European scrap prices rise in April, accessed on April 6, 2026, https://www.kallanish.com/en/news/steel/market-reports/article-details/western-european-scrap-prices-seen-increasing-0326/
- Global Iron and Steel Prices and News 05.04.2026 – SteelRadar, accessed on April 6, 2026, https://www.steelradar.com/en/
- Worsening supply concerns and gradual demand recovery … – alcircle, accessed on April 6, 2026, https://www.alcircle.com/press-release/worsening-supply-concerns-and-gradual-demand-recovery-stabilised-the-geopolitical-premium-and-the-centre-of-aluminium-prices-117900
- InSights & Intel – BigMint, accessed on April 6, 2026, https://www.bigmint.co/insights/scrap-recycling/scrap-metallics
- Chinese Scrap Market Sees Broad Price Drop on the Index– March 31, 2026 – ScrapMonster, accessed on April 6, 2026, https://www.scrapmonster.com/news/daily-scrap-metal-price-report/chinese-scrap-market-sees-broad-price-drop-on-the-index-2026-4-1/98816
- Prices – BigMint, accessed on April 6, 2026, https://www.bigmint.co/prices/scrap-recycling/india
- Melting Scrap Prices – Daily Scrap Metal Market Rates | BigMint, accessed on April 6, 2026, https://www.bigmint.co/prices/scrap-recycling
- Copper – Grade A – LME (London Metal Exchange) spot price – Price in dollars per metric ton, accessed on April 6, 2026, https://www.insee.fr/langue/en?url=%2Fen%2Fstatistiques%2Fserie%2F010002052
- Global Aluminium Price Surge Drives Scrap Market Volatility – RecycleInMe, accessed on April 6, 2026, https://www.recycleinme.com/scrap-news/newsdetails-970
- Worsening Supply Concerns and Gradual Demand Recovery Stabilized the Geopolitical Premium and the Center of Aluminum Prices [SMM Aluminum Morning Meeting Summary], accessed on April 6, 2026, https://news.metal.com/en/newscontent/103839995-Worsening-Supply-Concerns-and-Gradual-Demand-Recovery-Stabilized-the-Geopolitical-Premium-and-the-Center-of-Aluminum-Pri
- Market data – westmetall . market data . prices/lme stocks . copper, tin, lead, zinc, aluminium, nickel, gold, fine silver, accessed on April 6, 2026, https://www.westmetall.com/en/markdaten.php?action=table&field=LME_Al_cash
- Steel, Aluminum, Nickel, Rare Earth, New Energy, Copper Prices Charts & News-Shanghai Metals Market (SMM), accessed on April 6, 2026, https://www.metal.com/
- Gold Price Slides as Trump Signals Mixed Iran Resolution, accessed on April 6, 2026, https://discoveryalert.com.au/gold-price-slides-market-uncertainty-2026/
- #1 Prepared Scrap Prices – as of April 5, 2026 – iScrap App, accessed on April 6, 2026, https://iscrapapp.com/metals/1-prepared/
- Scrap & Secondary Metals: Market Trends, Prices & Analysis – Fastmarkets, accessed on April 6, 2026, https://www.fastmarkets.com/metals-and-mining/scrap-and-secondary/