

Updated 27 October 2026. People often assume the countries that produce the most waste are the ones that trade the most scrap. They are not. Household waste is made where people live, scrap metal is melted where steel is made, and the two maps overlap only partly. This article sets out what we can verify about each: which countries generate the most municipal waste, and which export and import the most recycled steel. We have not given a ranked "top 10" for waste because the published tables use different years and definitions and we could not confirm one. The steel scrap figures are from the Bureau of International Recycling (BIR). It is general information, not trading advice.
Waste: the biggest generators
The United Nations Environment Programme (UNEP) projects that municipal solid waste will rise from 2.1 billion tonnes in 2023 to 3.8 billion tonnes by 2050. It estimates the global direct cost of managing waste at US$252 billion in 2020, rising to US$361 billion once hidden costs are counted [1].
For country figures, the World Bank's What a Waste database is the standard source. Its 2018 edition put the United States at about 258 million tonnes in 2014, the highest of any country in that edition [2]. A summary of later World Bank data, reported by a secondary source, puts China at about 395 million tonnes, the United States at 265 million and India at 190 million, with Brazil (79 million) and Indonesia (65 million) behind [3]. China is generally described as the world's largest generator, at more than 15% of the total.
Three cautions apply. Years and definitions differ between editions, the secondary source has not been checked against the World Bank table, and municipal waste is not the same as scrap. Most metal scrap comes from industry, construction, demolition and end-of-life vehicles and equipment, not from household bins, so a large waste producer is not automatically a large scrap supplier.
Scrap: who sells and who buys
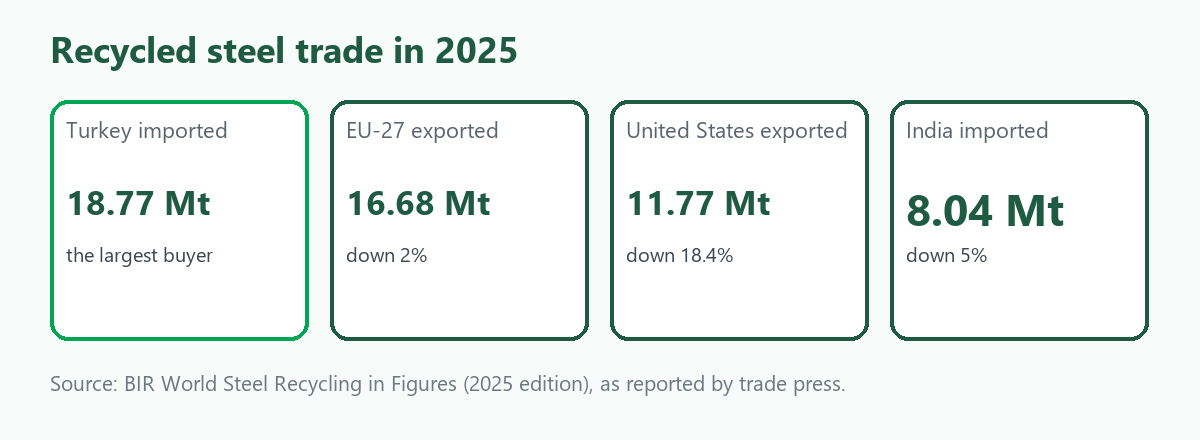
BIR's World Steel Recycling in Figures, as reported by trade press, gives the 2025 picture for recycled steel [4].
| Exporters, 2025 | Volume | Change |
|---|---|---|
| EU-27 | 16.68 million tonnes | down 2% |
| United States | 11.77 million tonnes | down 18.4% |
| Importers, 2025 | Volume | Change |
|---|---|---|
| Turkey | 18.77 million tonnes | fell |
| India | 8.04 million tonnes | down 5% |
| EU-27 | 4.99 million tonnes | up 28.8% |
| United States | 4.66 million tonnes | up 5.1% |
| Pakistan | 3.02 million tonnes | up 39.8% |
Source: BIR as reported by trade press [4]. We did not find the full BIR table, so these are the figures we could confirm, not a complete top 10.
Within the EU's exports, Turkey took 10.82 million tonnes (down 0.9%) and Egypt 1.86 million tonnes (up 13.4%), and the Netherlands was the largest single exporter at 3.92 million tonnes [4]. India's imports came mainly from the US (1.32 million tonnes, down 11.4%) and the UK (0.89 million tonnes, down 11%) [4].
Other sources give figures for individual countries. Japan exported 7.71 million tonnes of ferrous scrap in 2025 according to SteelOrbis, and the UK is estimated to export about 8 million tonnes of scrap of all kinds a year [5][6].
Why the two maps differ
- Steel is made where scrap is melted. Turkey makes most of its steel from scrap: BIR puts recycled steel at 86.8% of Turkish crude steel output, against 23.6% for China [4]. That is why Turkey imports so much.
- Waste is not scrap. Household waste carries little metal compared with demolition, manufacturing and vehicle recycling.
- Policy moves scrap. Duties, quotas and import rules decide where scrap goes. Pakistan's imports rose 39.8% in 2025 after a duty change, and the EU is deciding who can buy its scrap from May 2027.
- Geography and freight matter. Europe feeds Turkey and Egypt, the US feeds Turkey and Mexico, and Japan feeds Vietnam and Bangladesh.
Using this map
- If you sell scrap, look at the importers close to you and the rules they apply. See Europe Is Keeping Its Scrap. Who Pays? and Trading Scrap Internationally.
- If you buy scrap, know that exporters are shifting. US exports fell 18.4% in 2025 while EU exports were broadly flat.
- If you are starting a business, note that most scrap trade is regional. See How to Start a Recycling Company and Find Scrap.
- Check prices before you quote. Use the price calculator and compare offers on the marketplace.
For country detail in Australian context, our sister site covers world scrap trade, Turkey and Pakistan in more depth.
Frequently asked questions
Which country produces the most waste?
China is generally reported as the largest generator of municipal waste, followed by the United States and India, though tables differ by year and definition [2][3].
Which country exports the most scrap?
The EU-27 was the largest exporter of recycled steel in 2025 at 16.68 million tonnes, ahead of the United States at 11.77 million tonnes [4].
Which country imports the most scrap?
Turkey, at 18.77 million tonnes in 2025, followed by India at 8.04 million tonnes [4].
Is waste the same as scrap?
No. Scrap is material that can be melted or reprocessed, mostly from industry and end-of-life products, not household bins.
Why is there no top 10 here?
We could only confirm part of each ranking and chose not to guess the rest.
Sources
- UNEP, Global Waste Management Outlook 2024.
- World Bank, What a Waste 2.0 (2018), as cited by Guinness World Records.
- DevelopmentAid, World waste: statistics by country and brief facts, citing World Bank data (secondary source).
- BIR, World Steel Recycling in Figures (2025 edition), as reported by GMK Center, Recycling Magazine and trade press.
- SteelOrbis, Japan's steel scrap exports up 17.9 percent in 2025.
- letsrecycle.com, Export analysis: should Britain keep more scrap metal?.
Figures are as reported by the sources named and some come from trade-press summaries of the original reports. This article is general information, not financial or trading advice. ScrapTrade operates a scrap marketplace and has a commercial interest in the scrap trade.