


Updated 26 October 2026. Copper closed the day at US$6.49 a pound on the COMEX exchange, about US$14,306 a tonne, after a run that has taken it up 15% this year and 27% over twelve months [1]. The London Metal Exchange (LME) three-month contract set successive record highs in 2026 and peaked intraday at US$14,875 a tonne on 10 September, according to Fastmarkets [2]. Behind the price sit three forces that rarely line up: tight mine supply, a war that has disrupted the sulphuric acid that many copper operations depend on, and US trade policy that is pulling metal across the Atlantic. Forecasters disagree sharply on what happens next, from a surplus scenario near US$10,000 to bank calls above US$15,000 for 2027.
This article does three things. It reads the price chart with standard technical indicators, calculated from the daily data. It sets out the news and the policy backdrop in the main producing, consuming and trading countries, naming sources and flagging where they conflict. And it lays out what to expect, as scenarios and signposts rather than a prediction, because nobody knows. It is not investment advice. Copper prices are volatile, and the figures here are a snapshot.
Copper at a glance
| Measure | Figure | Source |
|---|---|---|
| COMEX copper, close 26 Oct 2026 | US$6.489 a pound (about US$14,306 a tonne, about A$20,361) | Yahoo Finance [1] |
| Change in 2026 so far | +15.3% (from US$5.630 at the end of 2025) | [1], ScrapTrade calculation |
| Change over 12 months | +27.4% | [1] |
| COMEX 52-week high (close) | US$6.804 on 9 Sep 2026, 4.6% above the latest close | [1] |
| COMEX 52-week low (close) | US$4.926 on 4 Nov 2025 | [1] |
| LME three-month record, intraday | US$14,875 a tonne on 10 Sep 2026 | Fastmarkets [2] |
| Copper concentrate treatment charge, 9 Oct 2026 | Minus US$272.20 a tonne, from minus US$69.70 at the start of 2026 | Fastmarkets [2] |
| US tariff on semi-finished copper | 50% since 1 Aug 2025. Refined copper still exempt, decision pending | Federal Register, ING [3][4] |
COMEX is the New York futures market and the LME is London's. They differ by a premium that has moved with US tariff expectations, so a COMEX price is not an LME price. This article uses COMEX for the technical analysis because a free, consistent daily history is available, and cites LME figures from named reports.
Technical analysis: what the chart says
Technical analysis reads price history for trend, momentum and levels where buyers and sellers have previously acted. It does not predict, and indicators often disagree. The numbers below are calculated from COMEX daily closes.
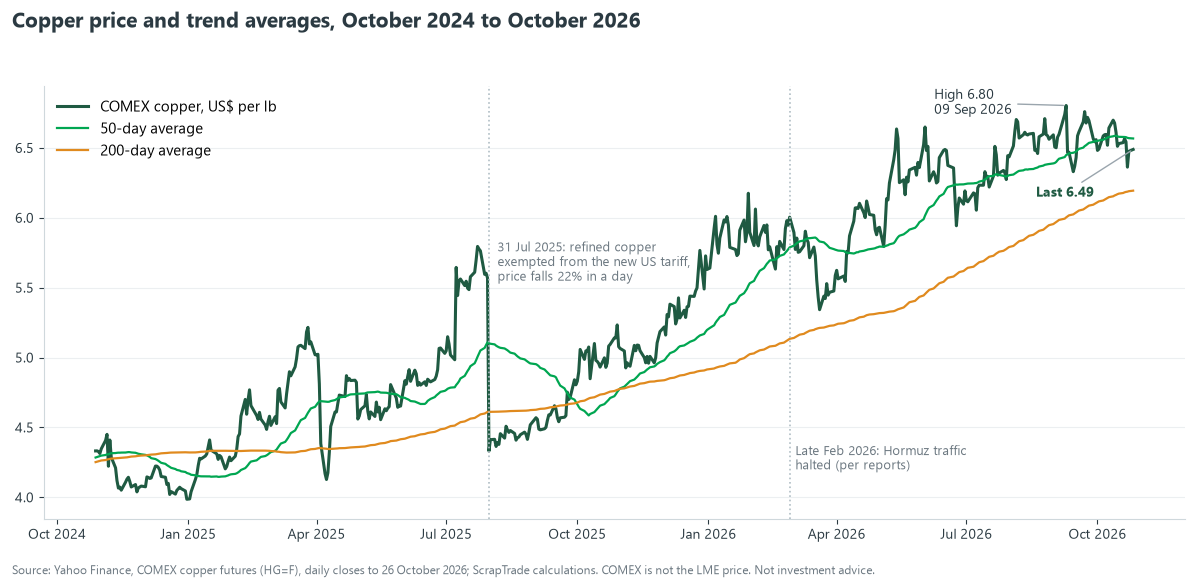
Trend: up, but stalling below short-term averages
| Indicator | Value | Reading |
|---|---|---|
| Latest close | 6.489 | |
| 20-day average | 6.551 | Price 0.9% below. Short-term softness |
| 50-day average | 6.568 | Price 1.2% below |
| 100-day average | 6.457 | Price 0.5% above |
| 200-day average | 6.194 | Price 4.8% above. The longer trend is up |
The 50-day average has been above the 200-day average since 31 October 2025, which analysts call a bullish alignment. Price is now below the 20 and 50-day averages but above the 100 and 200-day averages. That pattern is a pullback inside an uptrend, not a trend reversal, unless price falls below the 200-day average, currently about 6.19.
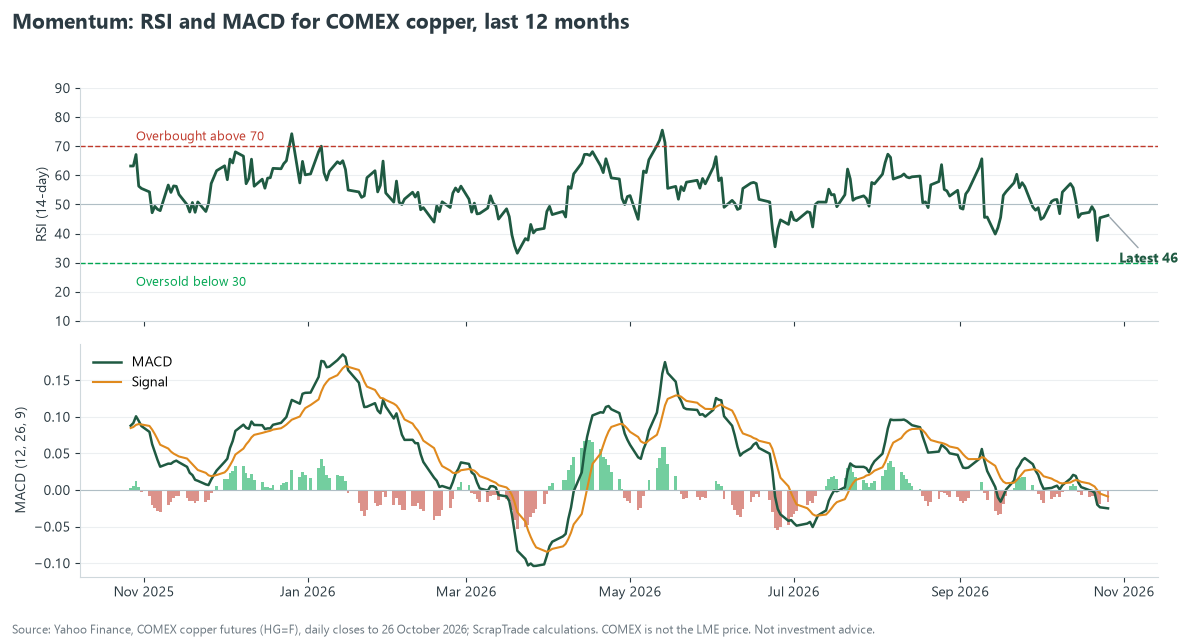
Momentum: neutral to slightly weak
| Indicator | Value | Reading |
|---|---|---|
| RSI (14-day) | 46.2 | Neutral. Readings above 70 are called overbought and below 30 oversold. Copper has not been overbought in the last month |
| MACD (12, 26, 9) | Minus 0.025, with the signal line at minus 0.009 | The MACD is below its signal line, a sign that momentum has turned down over recent weeks |
| Bollinger bands (20-day, 2 standard deviations) | 6.40 to 6.70 | The latest close is near the middle of the range |
| Average daily range (14-day ATR) | 0.085, about 1.3% of the price | A typical day moves about 8.5 cents |
Levels to watch
| Level (US$ a pound) | Why it matters |
|---|---|
| 6.80 | The 9 September 2026 closing high and the top of the range |
| 6.70 | Upper Bollinger band and the area of several September highs |
| 6.57 | The 50-day average, nearest resistance |
| 6.33 | The lowest close of the last 60 trading days |
| 6.19 | The 200-day average, the main trend line |
| 5.94 | The lowest close of the last 120 trading days |
Support and resistance levels are where price has reversed before, not guarantees. A decisive close below 6.19 would damage the technical picture. A close above 6.80 would confirm a new high.
Volatility and history
Copper's recent volatility is below its one-year level: the 30-day annualised volatility is about 18.5% against 27.2% over the past year, and the yearly picture shows how lumpy returns are.
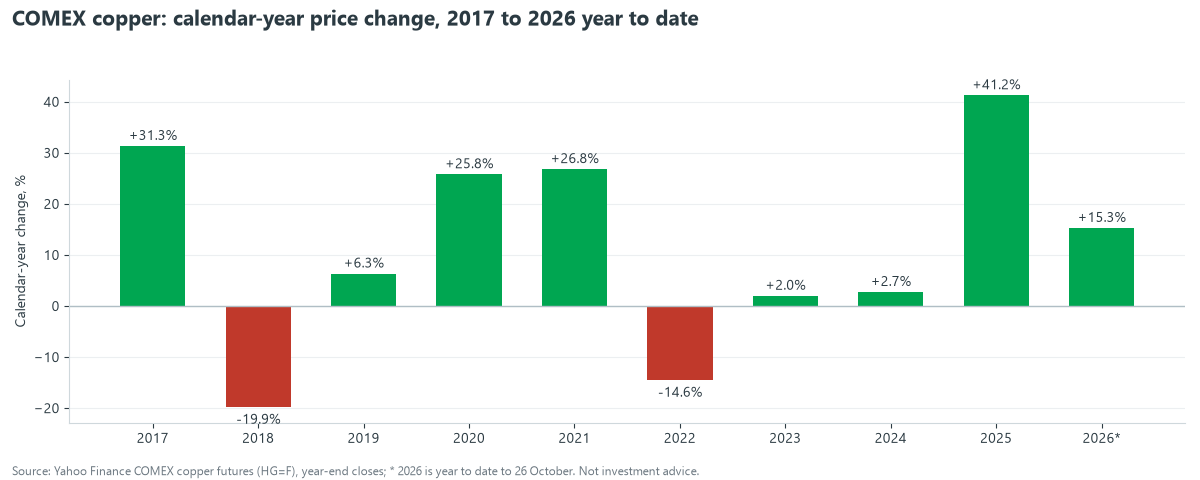
COMEX copper rose 41.2% in 2025 and is up 15.3% so far in 2026. Over the past ten years the worst peak-to-trough fall was 35.6%, into March 2020. The largest one-day fall in the past ten years of this data was 31 July 2025, when COMEX fell 22.3% in one session as refined copper was left out of the new US tariff, a reminder that policy headlines can move this market as hard as any chart pattern [1].
What technical analysis cannot do
It cannot see a tariff decision, a mine accident or a war. Several of the biggest moves in the past 15 months came from exactly those events, not from chart patterns. Use the indicators to frame risk, not to forecast.
How we got here: a timeline
| Date | Event | Source |
|---|---|---|
| 31 Jul 2025 | COMEX falls 22.3% in a day when refined copper is excluded from the new US tariff | Yahoo Finance [1] |
| 1 Aug 2025 | The US begins a 50% tariff on semi-finished copper products and copper-intensive derivatives. Refined copper, ore, concentrates and scrap are not tariffed | Federal Register, CRS [4][5] |
| Oct to Nov 2025 | COMEX bottoms near US$4.93 a pound | [1] |
| End 2025 | COMEX closes the year at US$5.63 a pound, up 41.2% | [1] |
| Late Feb 2026 | Traffic through the Strait of Hormuz is effectively halted, according to market reports | Kpler, others [10] |
| 20 Mar 2026 | COMEX touches US$5.34, about 10% below its level on 26 February | [1] |
| 8 Jun 2026 | A US proclamation keeps the 50% rate on semi-finished copper, lowers the domestic-content threshold for preferential treatment from 95% to 85%, and extends coverage to items such as electrical conductors and cables | ING [3] |
| 9 Sep 2026 | COMEX closes at US$6.804, its high for the period. LME peaks at US$14,875 the next day | [1][2] |
| 23 Sep 2026 | Escondida suspends all operations after a fatal accident | Fastmarkets [2] |
| 11 Oct 2026 | An avalanche kills two contract workers at El Teniente | Fastmarkets [2] |
The supply side: mines, smelters and treatment charges
Mine supply is the core of the bull case, and the data are not reassuring for buyers.
| Development | Detail | Source |
|---|---|---|
| Global mine output | Fell about 1% year on year in January to July 2026 | Fastmarkets [2] |
| Chile | Output down 7% year on year in the same period. Storms in July and August disrupted operations, and Antofagasta and Lundin cut 2026 guidance for Los Pelambres and Caserones | Fastmarkets [2] |
| Escondida and El Teniente | Escondida suspended after a fatal accident on 23 September. The El Teniente Andes Norte expansion has been suspended since August | Fastmarkets [2] |
| Grasberg (Indonesia) and Kamoa-Kakula (DRC) | Neither has returned to full rates. Reports put Freeport's 2026 production target down about 35% to 1.1 billion pounds, and Ivanhoe's 2026 guidance for Kamoa-Kakula at 380,000 to 420,000 tonnes | Fastmarkets, trade press [2][8] |
| Cobre Panama | A Panamanian government commission recommended on 30 September that talks begin with First Quantum on restarting the mine | Fastmarkets [2] |
| Some supply returning | Mongolian concentrate output up about 18% and Peruvian mine output up 2.2% in January to July | Fastmarkets [2] |
| Smelter output | World smelter production up 5.9% in January to July, per the International Copper Study Group | Fastmarkets [2] |
The mismatch shows up in treatment charges, the fee a mine pays a smelter to process concentrate. Fastmarkets' Asia-Pacific index fell to minus US$272.20 a tonne on 9 October. A negative charge means smelters are paying for ore, the clearest sign of competition for concentrate. The 2026 annual benchmark was set at zero, and talks at LME Week centre on the 2027 terms [2].
Goldman Sachs has cut its mine-supply forecast by 350,000 tonnes on slower recoveries at Grasberg and Kamoa-Kakula [8]. Supply responses are slow: one commentator puts the lead time from discovery to first production of a new copper mine at about 17 years, which is why price spikes do not quickly bring new tonnes.
War and geopolitics
The Hormuz and sulphuric acid shock
The most important geopolitical story for copper in 2026 is not about ore. Fastmarkets refers to a "US-Iran war" and a blockade of the Strait of Hormuz that has lifted sulphur, sulphuric acid and freight costs [2]. Market reports say traffic through the strait was effectively halted from late February 2026, trapping an estimated 600,000 tonnes of sulphur in the Gulf, about a quarter of global sulphur supply by one analysis [10]. Sulphur is the feedstock for sulphuric acid, which copper producers use in two ways.
- Solvent extraction and electrowinning (SX-EW) uses acid to leach copper from oxide ore. One report says it accounts for about 20% of global primary copper output, and that nearly half of copper production in the Democratic Republic of Congo depends on acid leaching [10]. Zambia, Chile and the DRC are named as most exposed. Goldman has estimated Zambia could lose about 125,000 tonnes of output this year if delays persist [10].
- Smelters produce acid as a by-product and sell it. High acid prices initially let smelters absorb deeper negative treatment charges, according to Fastmarkets [2].
Compounding this, China moved to stop exporting smelter by-product acid from May, which Goldman estimated could remove about 1.5 million tonnes through December, roughly a tenth of the seaborne market [10]. Acid prices were reported to be up more than 150% in key importing regions by July [10]. One analysis expects a lag of three to six months before production effects fully appear, so more of the impact may land in 2027 [10]. S&P Global's March assessment judged the immediate effect on copper to be muted [11], so the copper impact appears to have grown as the disruption has lasted. Several of these figures come from secondary sources and should be verified against primary data before anyone relies on them.
Other tensions
- US and China competing for refined metal. Goldman's October forecast upgrade cites weaker mine supply and deficits outside the United States, as competition between the US and China for refined copper intensifies [9].
- Resource nationalism and local risk. Panama's mine restart talks, Indonesia's smelter restart at Freeport in late August and Zambia's Nchanga smelter restart on 21 September after a 106-day shutdown all show how political and operational decisions at single sites move the global balance [2].
We did not find reliable current reporting on other conflicts' effects on copper, so we do not speculate about them.
Government policy in the major markets
United States
| Measure | Status | Source |
|---|---|---|
| Section 232 tariff on semi-finished copper and copper-intensive derivatives | 50% since 1 Aug 2025. A proclamation effective 8 Jun 2026 kept it at 50%, lowered the domestic-content threshold to 85% and widened coverage to items such as electrical conductors and cables | ING [3] |
| Refined copper | Exempt so far. The Commerce Department recommended a phased universal tariff of 15% from 1 Jan 2027 rising to 30% from 1 Jan 2028. As far as our sources show, the White House has not confirmed it | CRS, ING [3][4] |
| Copper scrap and concentrates | Not tariffed under the 2025 action | CRS [4] |
| Domestic sales of scrap | The 2025 order set a requirement, from 2027, that 25% of high-quality US-produced copper scrap be sold in the US, rising to 40% by 2029 | Mayer Brown [6] |
| Wider critical minerals policy | Copper is treated as a national-security and critical-minerals issue, with permitting acceleration and funding for processing and recycling | SMM [12] |
The refined-copper decision is the single most important policy variable. It has drawn metal into the US: ING reports that US imports surged from February 2026, COMEX stocks are at record highs while LME and Shanghai stocks have fallen sharply, which it describes as a geographic shift driven by tariff arbitrage, not demand growth [3]. The COMEX premium over the LME has re-widened, reaching about US$400 a tonne in early June, still well below the roughly US$2,937 peak of late July 2025, according to ING [3]. A bank estimate cited by CNBC put the odds implied by the premium at about 15% for a 15% tariff in January 2027 and 37% for a 30% duty in 2028 [13]. A September report said the administration is "still evaluating all options" [13].
China
| Measure | Status | Source |
|---|---|---|
| Smelter capacity | The China Smelter Purchasing Team proposed production cuts of over 10% for 2026, but Fastmarkets reports no concrete plans. Beijing has also tightened rules for new smelters | SMM, CRU, Fastmarkets [2][12] |
| By-product acid exports | Halted from May, tightening world acid supply | Kpler, Goldman via trade press [10] |
| Cathode trade | January to September 2026 imports were 2.14 million tonnes, down 16.3% year on year, while exports rose. September exports were 47,900 tonnes, up 81% | SMM [12] |
| Scrap | Policy tightening has reduced tax-inclusive scrap supply, cutting scrap-derived anode output | SMM [12] |
China's position matters because it is the largest refined-copper consumer and the largest buyer of scrap. Its cathode imports are falling and exports are rising at the same time as the US pulls in metal, which leaves the rest of the world short, a point echoed in Goldman's deficit-outside-the-US view [9].
Europe, Japan and others
- European Union. The revised Waste Shipment Regulation is moving to restrict metal scrap exports to non-OECD countries from May 2027, with a draft authorised list that would exclude India, Egypt and Pakistan among others. It governs EU exports, but it reshapes where scrap flows. See Europe Is Keeping Its Scrap. Who Pays?.
- Japan. Mitsubishi Materials will stop processing concentrates at its Onahama plant by the end of March 2027 and is shifting towards scrap, Fastmarkets reports [2].
- Panama, Indonesia, Zambia. Restart talks and smelter restarts, described above, are policy decisions with global price effects [2].
What it means for copper scrap
Scrap is where this matters most to traders. Copper scrap is priced at a discount to the benchmark, and when concentrate is scarce, smelters lean on scrap. SMM's weekly reviews of copper scrap outside China in July 2026 reported tight supply, limited cargo and high discount rates supported by high cathode premiums [14]. Mysteel noted in August that with both concentrate and scrap supply tight, the refined market has lost some of its usual buffers against disruption [14]. In Australia, declared export values for copper-alloy scrap rose from about A$4,833 a tonne in 2017-18 to A$12,243 in 2025-26, a 153% increase [15]. Read our guide to copper scrap grades, prices and demand for what each grade is worth.
For anyone buying or selling scrap, the practical points are:
- Price at the time of sale. A 1.3% average daily range means a lot worth A$50,000 can move by about A$650 in a typical day.
- Know your discount. The gap between the benchmark and what a buyer pays for each grade varies, so ask for a firm offer. The live price calculator gives an indicative reference, and its figures are estimates, not quotes.
- Sell before you buy where you can, so you are not holding stock through a swing.
- Watch the rules. Tariffs, acid exports and scrap-sales mandates are changing the flows.
What to expect: scenarios and signposts
What the forecasters say
| Source | View | Note |
|---|---|---|
| Goldman Sachs | 2027 average LME US$15,400 a tonne (raised from US$13,800), year-end 2026 US$14,700. Cites weaker mine supply and an estimated 2026 deficit outside the US of about 950,000 tonnes | Reported via Reuters and Mining.com [9] |
| UBS | Global deficit of 219,000 tonnes in 2026 widening to 379,000 tonnes in 2027, with prices near US$15,500 in 2027. Backs long positions | Tradingpedia, 9 Oct 2026 [8] |
| ING | Global deficit of about 35,000 tonnes in 2026, with LME easing in the second half as the stockpiling impulse fades. Tariff confirmation would widen the COMEX premium | ING, mid-2026 [3] |
| Reuters analyst poll (July 2026) | LME cash average US$13,169 in 2026 and US$13,059 in 2027 | As cited in market commentary [16] |
| Goldman earlier forecast | US$10,000 to 11,000 through 2026 and 2027 in a surplus scenario | Published before the 2026 rally [17] |
The spread of views, from about US$10,000 to over US$15,000, is itself the message. Forecasts made before the 2026 rally look stale, and those made since lean bullish on supply.
Three scenarios
| Scenario | What would have to happen | What it would mean |
|---|---|---|
| Bull: deficit deepens | Refined copper is tariffed, acid shortages cut output in Africa and Chile, mine restarts slip, and China's smelters do not cut | New highs, with the COMEX premium widening. Highest risk for buyers holding unhedged demand |
| Base: choppy, high | Mine supply recovers slowly, the US decision drags on, Hormuz tension continues without escalating | Range trading, roughly between the 200-day average and the September high, with sharp reactions to headlines |
| Bear: relief | The tariff is rejected or delayed, Hormuz reopens and acid normalises, Chinese demand slows, mines restart on time | A fall back towards the 5.9 to 6.2 area on the chart and possibly lower, with the COMEX premium collapsing |
We do not put probabilities on these. They show what would need to change.
Signposts to watch
| Signpost | Why it matters |
|---|---|
| US decision on refined copper | The 15% from 2027 and 30% from 2028 schedule, or a decision against it, drives the COMEX premium and metal flows |
| COMEX minus LME spread and stock levels | Shows whether tariff arbitrage is building or unwinding |
| Treatment and refining charges | Deeper negatives mean tighter concentrate |
| Sulphur, acid and Hormuz shipping | Determines whether African and Chilean SX-EW output is hit |
| Escondida, El Teniente, Grasberg, Kamoa-Kakula | Restart dates decide the 2027 balance |
| China's smelter cuts, cathode flows and acid exports | The world's largest buyer's behaviour |
| Shanghai and LME stocks | Tightness of physical supply |
| The 200-day average (about 6.19) and the 6.80 high | The technical lines that would signal a change of trend |
Frequently asked questions
What is the copper price today?
COMEX copper closed at US$6.489 a pound on 26 October 2026, about US$14,306 a tonne [1]. LME prices differ by a premium that has moved with US tariff expectations, and a market-data report put LME three-month copper near US$14,300 on 21 October.
Is copper at a record high?
LME three-month copper peaked intraday at US$14,875 a tonne on 10 September 2026, according to Fastmarkets, so current prices are a few percent below that [2]. Sources differ on exact record levels.
Why is copper so expensive?
Tight mine supply, record-low treatment charges, tariff-driven stockpiling in the US and a war-related squeeze on sulphuric acid, set against steady demand from electrification and grids [2][3].
Where is copper going next?
No one knows. Goldman and UBS see prices around US$15,000 to 15,500 in 2027, while other forecasts and scenarios are lower. See the scenarios and signposts above.
What does the US copper tariff cover?
A 50% tariff on semi-finished copper products and copper-intensive derivatives since August 2025. Refined copper, concentrates and scrap are not tariffed, but a decision on refined copper is pending [3][4].
How does this affect scrap sellers?
Scrap prices follow the benchmark at a discount that varies with supply and premiums. Check a firm offer and price at the time of sale.
Sources
- Yahoo Finance, COMEX copper futures (HG=F), daily history to 26 October 2026. Indicators and returns are ScrapTrade calculations.
- Fastmarkets, Base metals head to LME Week 2026 with record-low TCs, war-hit supply chains.
- ING Think, What's next for US copper import tariffs.
- Congressional Research Service, Section 232 National Security Tariffs on Copper Imports.
- Federal Register, Adjusting Imports of Copper Into the United States (5 August 2025).
- Mayer Brown, Unearthing US vulnerabilities: President Trump outlines steps to strengthen the US copper industry (1 August 2025).
- The White House, Fact Sheet: President Trump takes action to address the threat to national security from imports of copper.
- Tradingpedia, UBS projects deeper copper shortfall and higher prices by 2027 (9 October 2026); Northern Miner, Goldman slashes copper supply outlook as deficits widen.
- Mining.com, Goldman Sachs raised its 2027 average LME copper forecast to US$15,400, reporting Reuters.
- Kpler, Sulphur and sulphuric acid in 2026: the feedstock crisis cascading through copper, nickel and fertilisers; Fastmarkets, 10 topics in focus at CESCO Week 2026; Mining Weekly, War squeezes global mining as diesel and acid supplies tighten (April 2026). Several figures are from secondary reports.
- S&P Global Market Intelligence, Middle East war: copper and nickel supply risk (March 2026).
- SMM, China's September 2026 copper cathode imports rebound; CRU, How CSPT smelter cuts could reshape China's copper demand in 2026; SMM, Copper-related policy shifts across the Americas.
- CNBC, How a niche copper trade became a real-time gauge of Trump's next tariff move (14 August 2026), as summarised by search results; TechTimes, White House copper tariff stall (10 September 2026).
- SMM, Ex-China copper scrap weekly review; Mysteel, LME copper squeeze eases but supply risks remain.
- Department of Climate Change, Energy, the Environment and Water, Waste exports data collation, September 2026 (Australian Bureau of Statistics records). See Australia's Scrap Metal Exports: 2025-26 Data.
- Reuters analyst poll, July 2026, as cited in market commentary including Capital.com's copper price forecast.
- Goldman Sachs, Copper prices are forecast to decline somewhat from record highs in 2026.
This article is general information, not investment, financial or trading advice. Prices, forecasts and news are as reported on 26 October 2026 and change quickly. Several sources are secondary or conflict on detail, as noted. ScrapTrade operates a scrap marketplace and has a commercial interest in the scrap trade.